Statistics I: Collection, Organization & Presentation of Data
Abdullah Al Mahmud
Tabluation

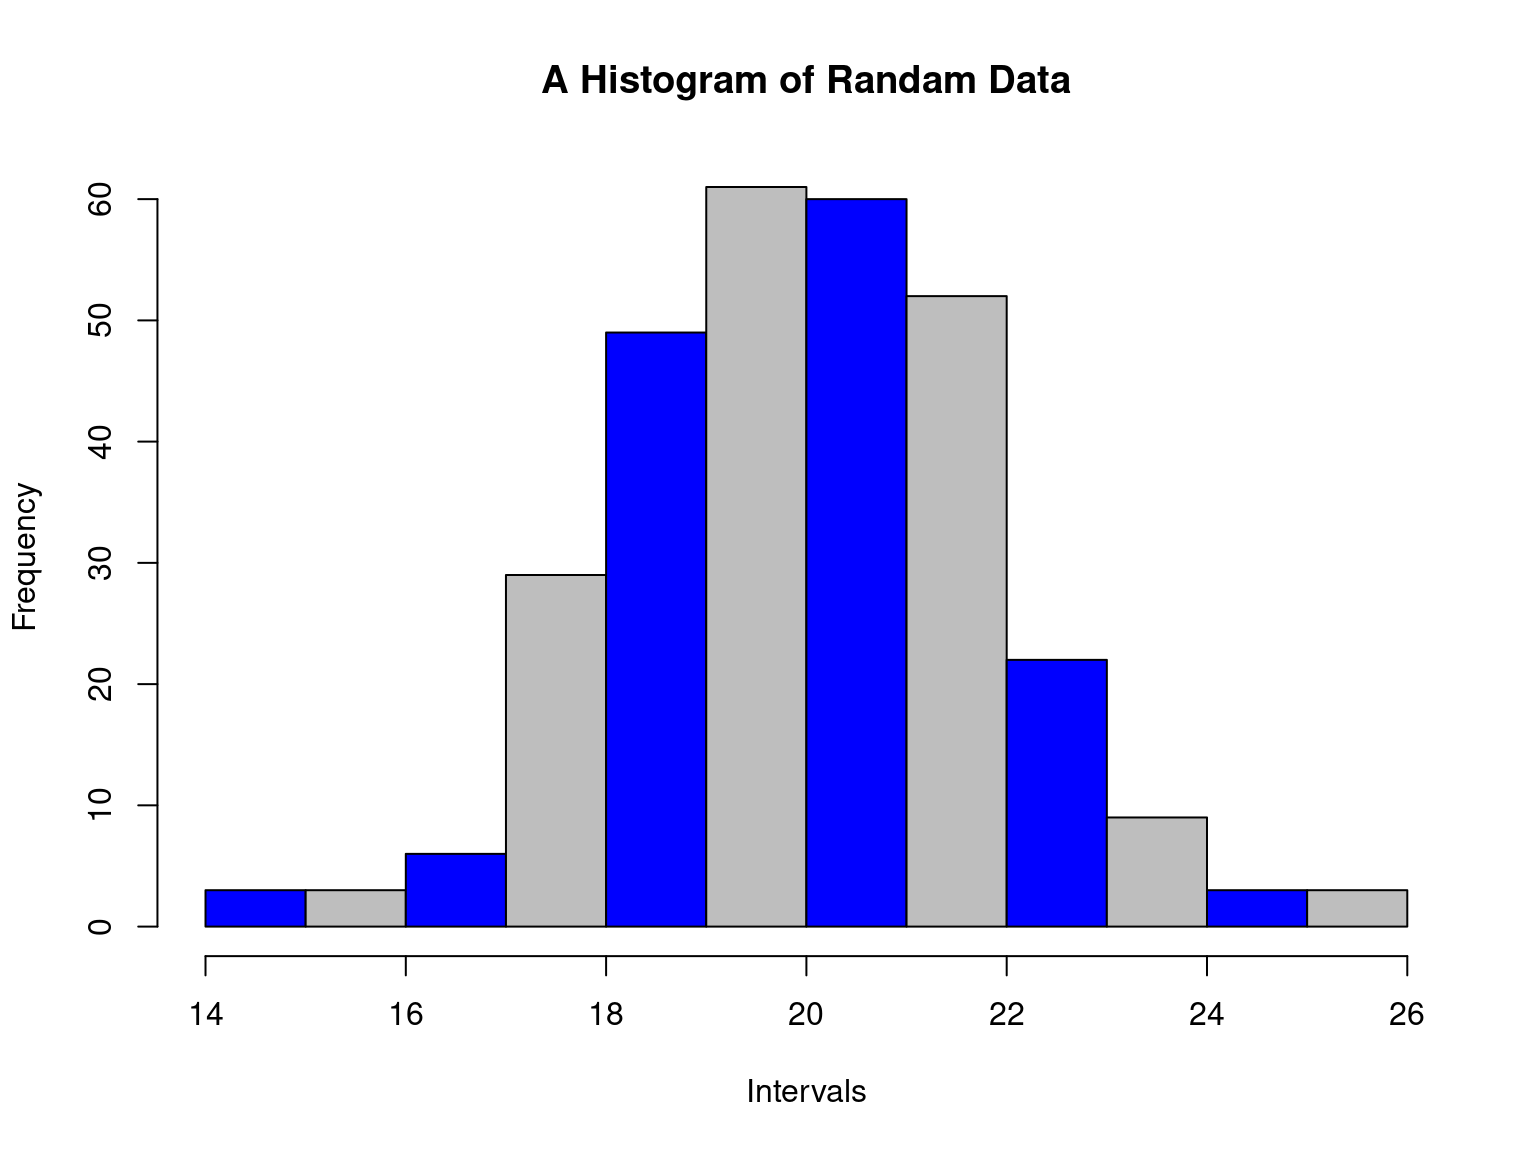
Histogram
- Inclusive vs exclusive
What does it tell us
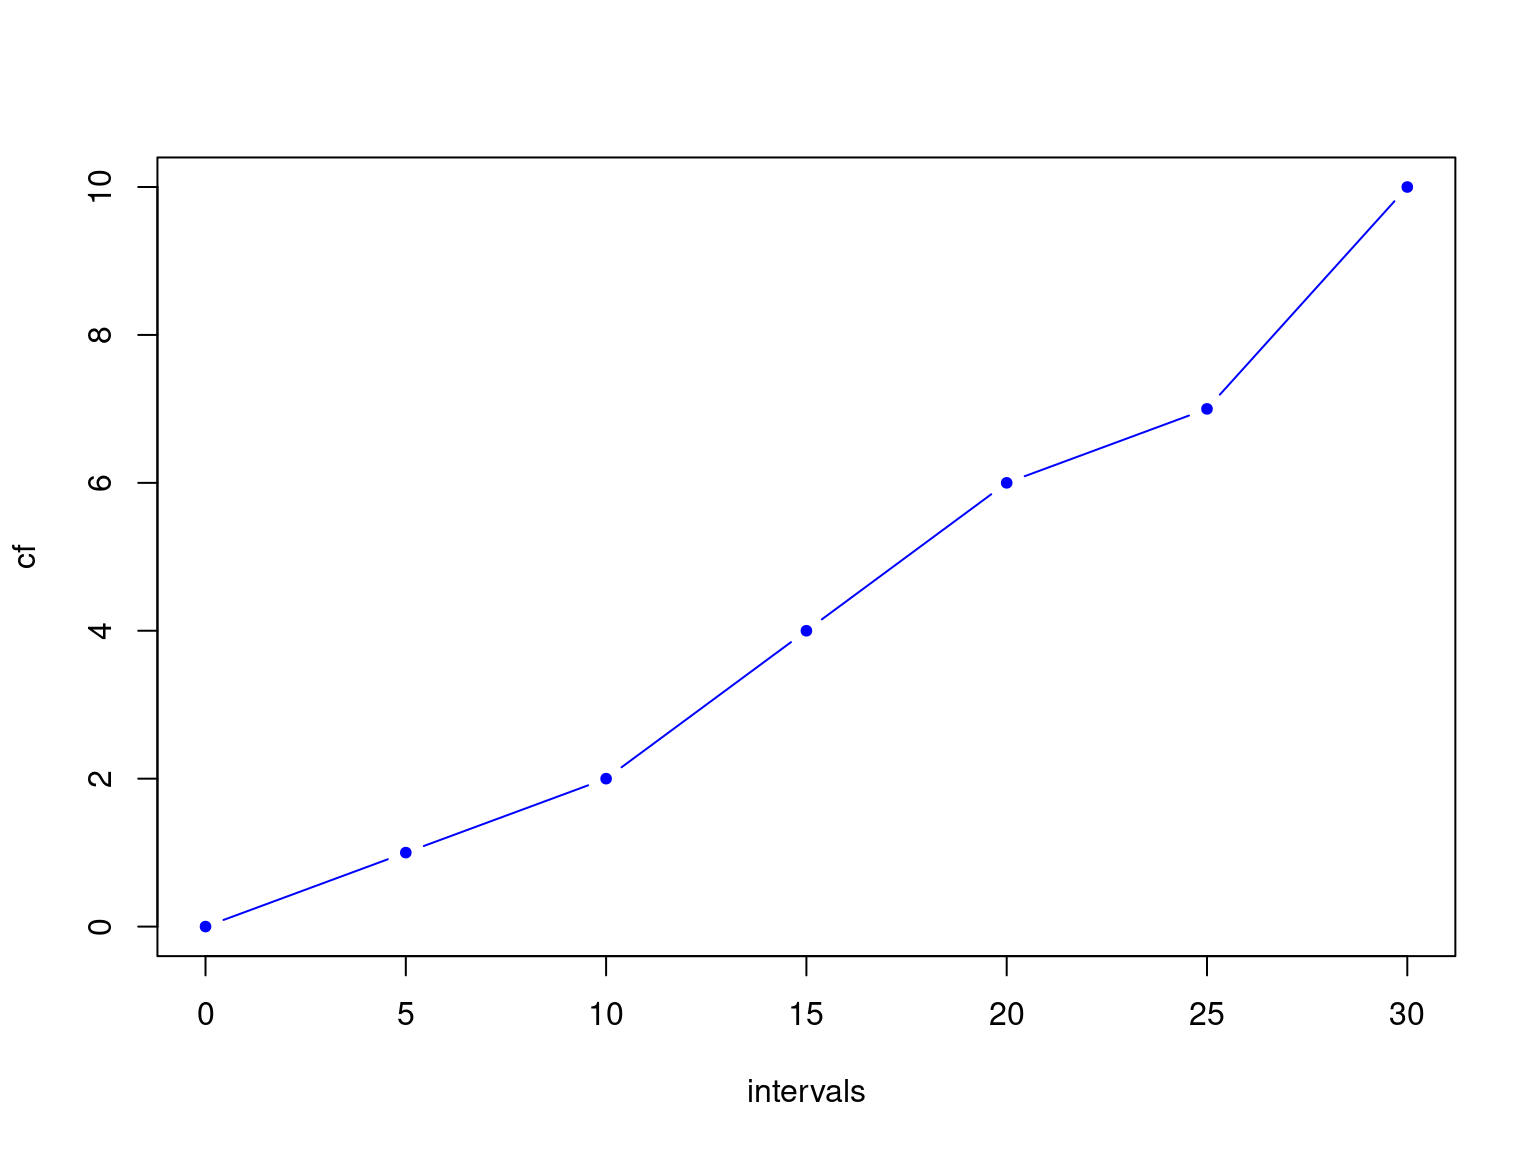
What Ogives tell us
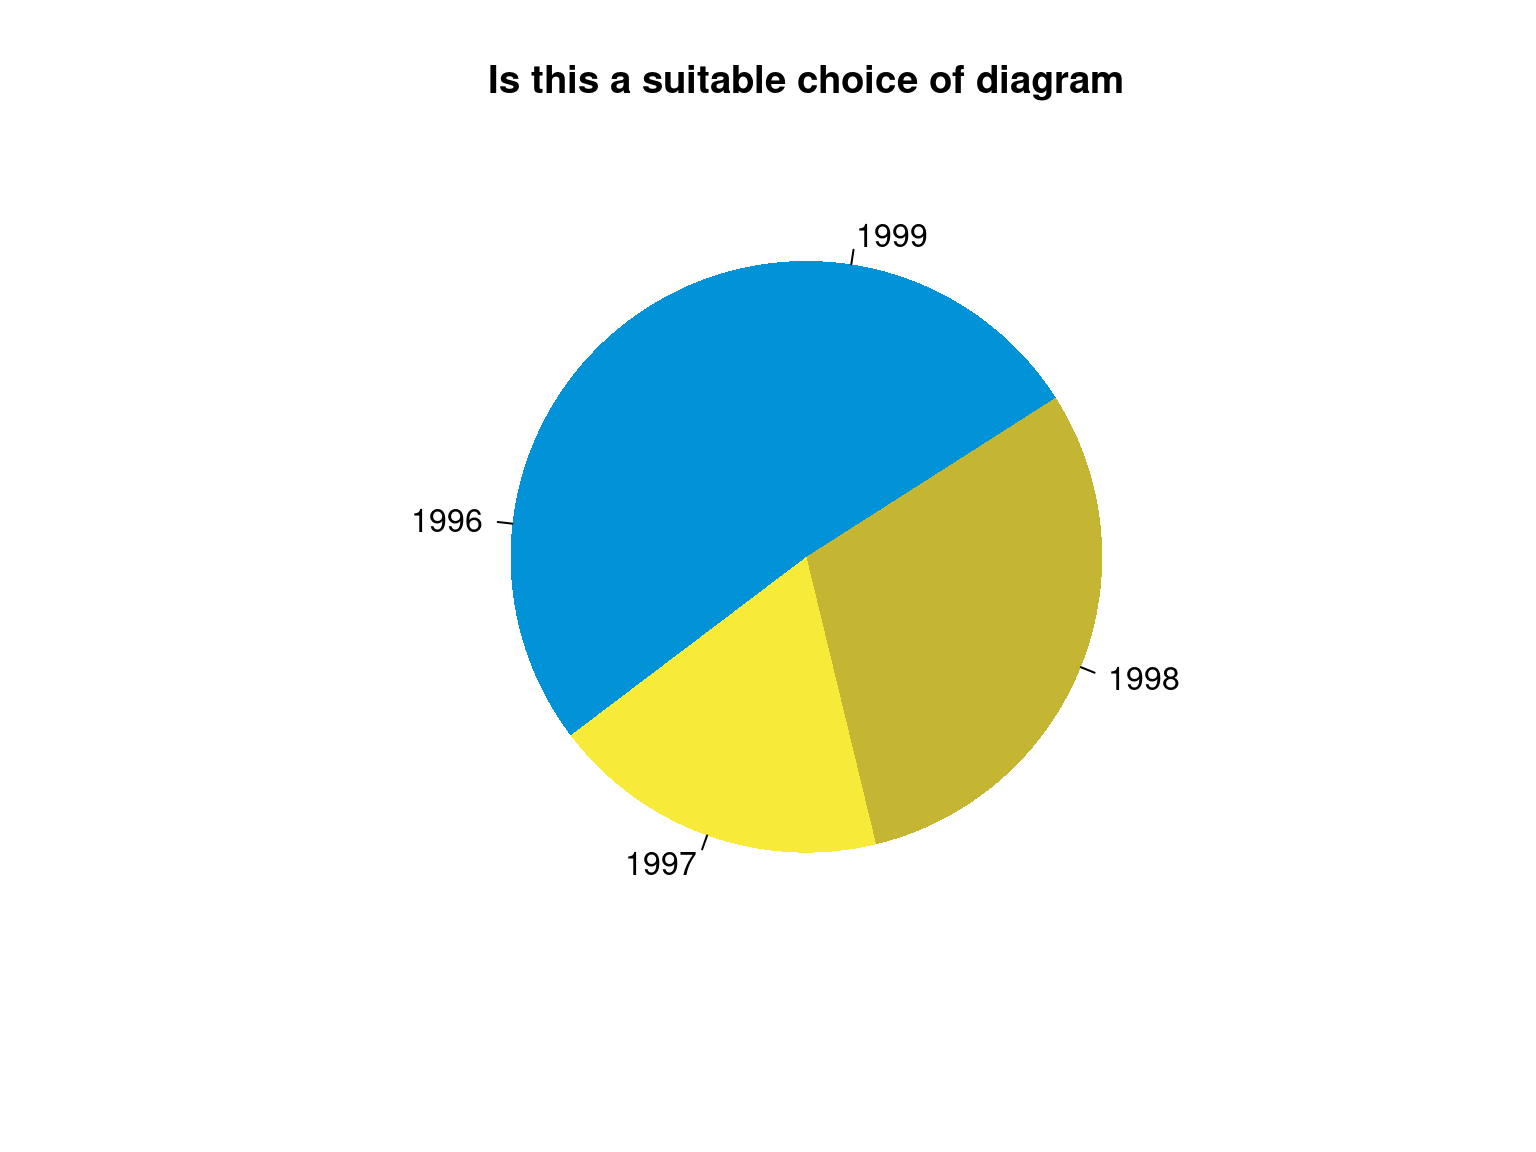
Choose Diagram
| year | Sales ($) |
|---|---|
| 1996 | 76 |
| 1997 | 58 |
| 1998 | 95 |
| 1999 | 85 |
| Category | Cost(Tk.) |
|---|---|
| House rent | 10,000 |
| Utility Bill | 3,000 |
| Telecom | 2000 |