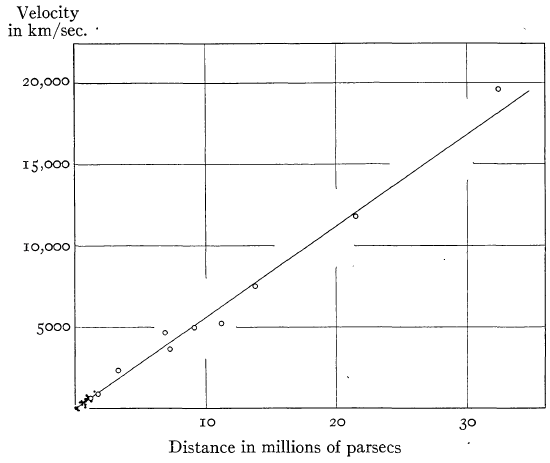
Why This Chapter is Important
We knew the universe is expanding from the knowledge of this
chapter!
We learn in this chapter
- How to make bread without wheat/flour
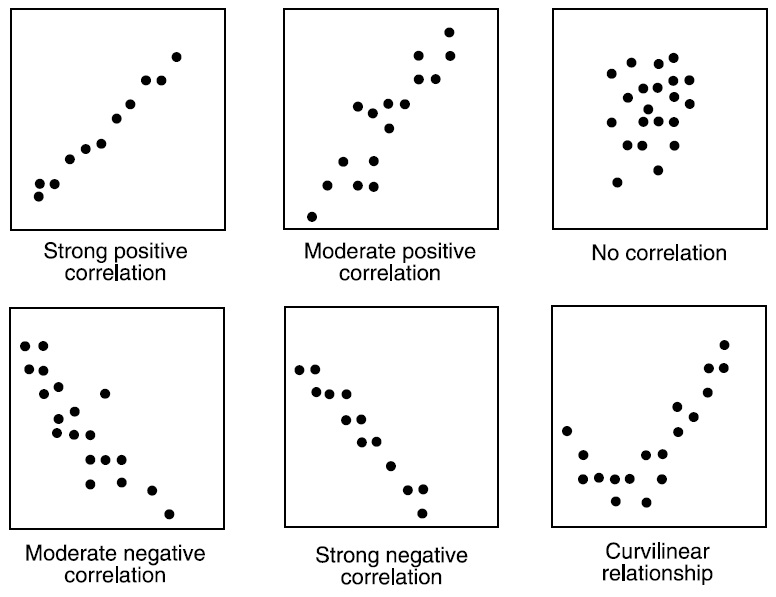
Scatter Plot
Sequence
Scatter Plot \(\rightarrow\)
Correlation \(\rightarrow\)
Regression
| Preliminary idea about relationship |
Measures linear relationship |
Measures Influence |
| Either variable can be independent (usually) |
Does not clarify dependency |
Predicts dependent variable based on independent one. |
Correlation
Linear relationship between two variables
Corrleation, \(r = \frac{\sum (x_i - \bar
x)(y_i - \bar y)}{\sqrt{\frac{\sum(x_i - \bar x)^2}{n}\frac{\sum(y_i -
\bar y)^2}{n}}}; -1 \le r \le 1\)
- \(r =
\frac{Cov(x,y)}{\sigma_x \sigma_y}\)
- Compare with \[\sigma ^2
= \sum_{i=1}^n \frac{(x_i-\bar x)^2}{n}\]
Scatter Plot And Correlation
\(r^2=R^2 \rightarrow\) Coefficient
of determination
\(R^2 = 80\% \rightarrow\) 80% of
total variation in Y (say, brightness of stars) can be explained by X
(say, distance).
r: Estimating Mechanism
Make a table with columns for
- \((x_i-\bar x)\)
- \((y_i-\bar y)\)
- \((x_i-\bar x)(y_i-\bar y)\)
- \((x_i-\bar x)^2\)
- \((y_i-\bar y)^2\)
Then sum them and put in the formula
Features of r
- Independent of origin and scale
- \(-1 \le r \le
1\)
- \(r = \sqrt{b_{yx} \cdot
b_{xy}}\) (Concerning GM of regression coeff)
- \(\frac{b_{yx}+b_{xy}}{2}
\ge r\) (About AM)
- \(r = 0
\rightarrow\) no linear relationship
Rank Correlation
| 1 |
20 |
15 |
1 |
4 |
| 2 |
18 |
20 |
3 |
1 |
| 3 |
16 |
14 |
5 |
5 |
| 4 |
17 |
13 |
4 |
6 |
| 5 |
15 |
18 |
6 |
2 |
| 6 |
12 |
10 |
9 |
8 |
| 7 |
11 |
17 |
10 |
3 |
| 8 |
19 |
9 |
2 |
9 |
| 9 |
14 |
12 |
7 |
7 |
| 10 |
13 |
8 |
8 |
10 |
Coefficient, \(\rho = 1- \frac{6 \sum
d_i^2}{n(n^2-1)}\)
Linear Equation/ Straight Lines
\(Y = c + mx;\) m is slope c is
intercept
\(m = \frac{dy}{dx} = tan \theta=\)
Change in y due to change in x.
Bread without sour or wheat!
Regression Coefficient
\(b_{yx} = \frac{\sum(x_i-\bar x)(y_i-\bar
y)}{\sum(x_i-\bar x)^2} = \frac{Cov(x,y)}{\sigma_x^2}\)
SImpler, \(b_{yx} = \frac{\sum xy-
\frac{\sum x \sum y}{n}}{\sum x^2 - \frac{(\sum x)^2}{n}}\)
\(b_{xy}=?\)
Example
| 11 |
15 |
| 9 |
20 |
| 10 |
10 |
| 16 |
7 |
| 12 |
18 |
| 7 |
2 |
| 8 |
8 |
| 6 |
13 |
| 15 |
14 |
| 3 |
17 |
- Make a scatter plot and explain
- Find correlation and regression coefficient (r, a, & b) and
explain
- Correlation, r = -0.06
- Regression (a, b): 13.26, -0.09
Properties of b
- independent of origin and scale
- \(r = \sqrt{b_{yx} \cdot
b_{xy}}\)
- \(\frac{b_{yx}+b_{xy}}{2}
\ge r\)
- If \(b_{yx} > 1,
b_{xy} < 1\)
- If regression lines coincide, r = 1
- If \(\theta = 90^o, r =
0\)
Purity of Coefficients
- \(r = \frac{\sum (x_i - \bar x)(y_i - \bar
y)}{\sqrt{\frac{\sum(x_i - \bar x)^2}{n}\frac{\sum(y_i - \bar
y)^2}{n}}}\)
- \(\rho = 1- \frac{6 \sum
d_i^2}{n(n^2-1)}\)
- b or \(\beta\)
