Time Series
Abdullah Al Mahmud
Time Series
What is Time Series Data?
Data arranged chronologically
\(Y_t = f(t); t = t_1, t_2, t_3, \cdots, t_n\)
Example
| Year | Production |
|---|---|
| 2001 | 11 |
| 2002 | 9 |
| 2003 | 10 |
| 2004 | 16 |
| 2005 | 12 |
Components of Time Series
Four Components
- Trend (increase/decrease)
- Seasonal variation
- Cyclic variation
- Irregular/Random variation
Uses
- Analyze past behavior
- Forecasting
- Comparison by time/place
- Segregation of components
- Performance measure
Symbols
\(Y_t =\) Values of series at time t
\(T_t =\) Trend
\(S_t =\) Seasonal
\(C_t =\) Cyclic
\(R_t =\) Random/irregular
Models
Additive Model
\(Y_t = T_t + S_t + C_t + R_t\)
- \(C_t\) and \(S_t\) can be \(\pm\)ve
- \(R_t\) can also be \(\pm\)ve, but in the long run, \(\sum R_t = 0\)
Multiplicative Model
- \(Y_t = T_t \times S_t \times C_t \times R_t\)
- \(S_t, C_t, R_t\) refer to deviation from unit
- \(S_t\) equals unity in 1 year, \(C_t\) in a cycle, and GM of \(R_t\) is unity (1).
Comparison of Models
- Components in additive models are independent.
- In multiplicative models, components are interwined.
Measuring Trend
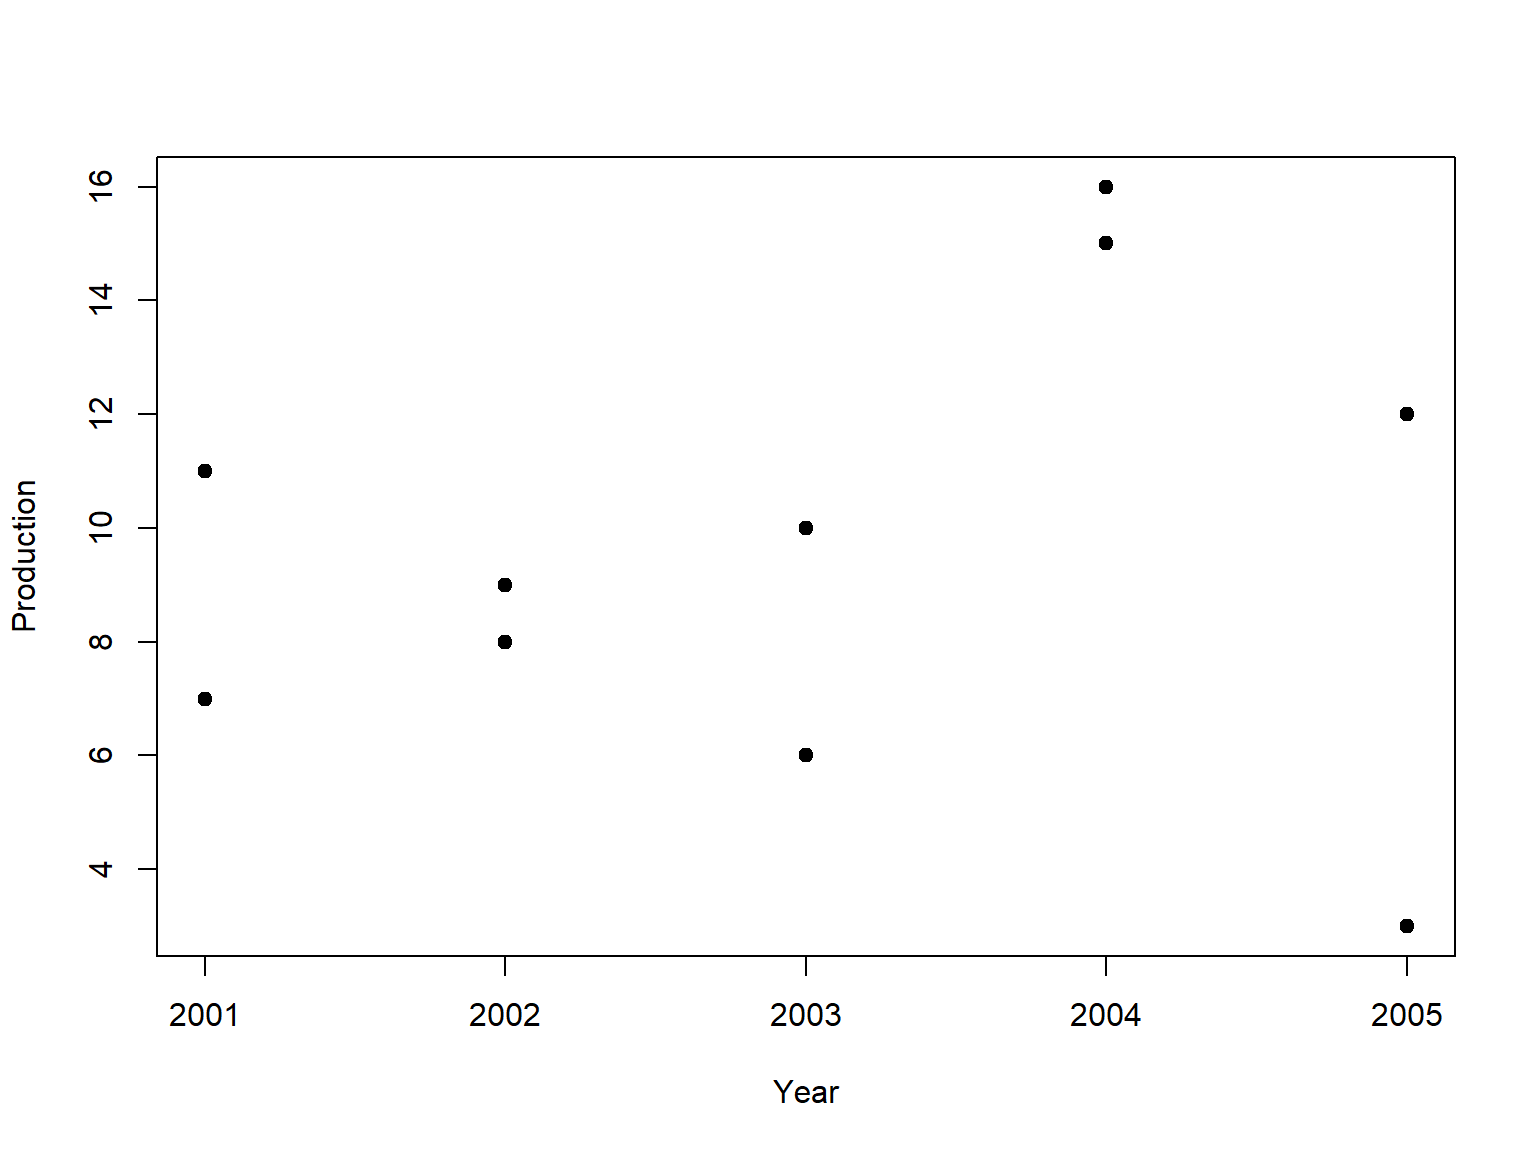
Graphical/Free-hand Method
| Year | Production |
|---|---|
| 2001 | 11 |
| 2002 | 9 |
| 2003 | 10 |
| 2004 | 16 |
| 2005 | 12 |
| 2001 | 7 |
| 2002 | 8 |
| 2003 | 6 |
| 2004 | 15 |
| 2005 | 3 |
Sem-average
| Year | Production |
|---|---|
| 2001 | 11 |
| 2002 | 9 |
| 2003 | 10 |
| 2004 | 16 |
| 2005 | 12 |
| 2001 | 7 |
| 2002 | 8 |
| 2003 | 6 |
| 2004 | 15 |
| 2005 | 3 |
Steps
- Separate the data into two equal parts (if odd-numbered, omit middle-most)
- Estimate averages of each group
- Put these two values on the scatter plot and extend
Moving Average
| Year | Production | 3-Yearly Moving Average |
|---|---|---|
| 2001 | 412 | NA |
| 2002 | 438 | \({412+438+446}\over{3}=432\) |
| 2003 | 446 | \(\frac{438+446+454}3=446\) |
| 2004 | 454 | 457 |
| 2005 | 470 | 469 |
| 2006 | 483 | \(\frac{470+483+490}3=481\) |
| 2007 | 490 | NA |